Working Capital Management Guide: Cash Flow, Receivables, Inventory, Payables, and Optimization (2024-2026)
schema: | { “@context”: “https://schema.org”, “@graph”: [ { “@type”: “Article”, “headline”: “Working Capital Management Guide: Cash Flow, Receivables, Inventory, Payables, and Optimization (2024-2026)”, “description”: “Comprehensive working capital management guide covering cash conversion cycles, receivables management, inventory optimization, payables strategy, metrics, and cash flow improvement techniques.”, “image”: “https://bato.com.np/assets/images/working-capital-management.jpg”, “datePublished”: “2024-07-10”, “dateModified”: “2026-02-21”, “author”: { “@type”: “Person”, “name”: “Elizabeth Thompson” }, “publisher”: { “@type”: “Organization”, “name”: “BATO - Business Audit & Tax Organization”, “logo”: { “@type”: “ImageObject”, “url”: “https://bato.com.np/assets/images/logo.png” } } } ] }
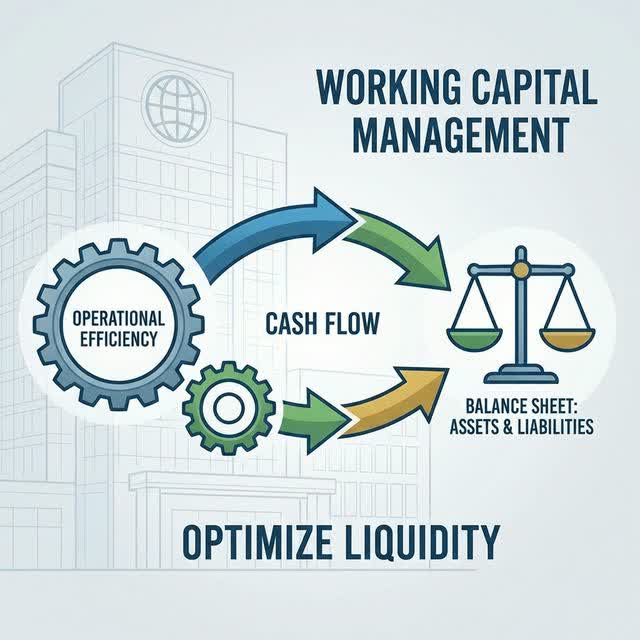
Working capital management directly impacts cash flow and company valuation. This comprehensive guide covers optimization techniques, metrics, and strategies for improving liquidity.
- Working Capital Fundamentals
- Accounts Receivable Management
- Inventory Management
- Accounts Payable and Cash Management
- Working Capital Financing
- Working Capital KPIs and Monitoring
- Sector-Specific Considerations
- Conclusion
- Resources
Working Capital Fundamentals
What is Working Capital?
Definition and Components:
Working Capital = Current Assets - Current Liabilities
                = (Cash + Receivables + Inventory) - (Payables + Accruals)

Represents: Short-term funds available for operations

Components:

Current Assets:
✓ Cash (most liquid)
✓ Accounts receivable (customer unpaid invoices)
✓ Inventory (raw materials, WIP, finished goods)
✓ Prepaid expenses and other current assets

Current Liabilities:
✓ Accounts payable (vendor unpaid invoices)
✓ Accrued expenses (salaries, taxes owed)
✓ Short-term debt (current portion of loans)
✓ Deferred revenue (customer prepayments)

Example Working Capital Calculation:

Manufacturing company balance sheet (simplified):

Current Assets:
- Cash:                    $5M
- Accounts receivable:    $12M
- Inventory:              $18M
- Prepaid:                 $1M
Total current assets:     $36M

Current Liabilities:
- Accounts payable:       $8M
- Accrued expenses:       $2M
- Short-term debt:        $4M
- Deferred revenue:       $1M
Total current liabilities: $15M

Working Capital: $36M - $15M = $21M

Interpretation:
- $21M in net short-term assets available for operations
- Company has cushion to cover short-term obligations
- Cash conversion cycle determines if sustainable
Working Capital Metrics
Key Performance Indicators:
1. Cash Conversion Cycle (CCC)
   Formula: DIO + DSO - DPO

   Where:
   - DIO = Days Inventory Outstanding (inventory holding time)
   - DSO = Days Sales Outstanding (receivables collection time)
   - DPO = Days Payable Outstanding (payables payment time)

   Interpretation:
   - Negative CCC: Best (pay after you sell)
   - 0-30 days: Healthy
   - 30-60 days: Acceptable
   - 60-90 days: Needs improvement
   - 90+ days: Poor (cash drain)

   Example:
   DIO: 45 days (average inventory held)
   DSO: 35 days (average time to collect from customers)
   DPO: 30 days (average time before paying vendors)
   CCC: 45 + 35 - 30 = 50 days

   Meaning: Company needs to finance 50 days of operations
            from own cash (before getting paid by customers)
Detailed Metrics:
2. Days Sales Outstanding (DSO)
   Formula: (Accounts Receivable / Revenue) × Days in Period

   Calculation:
   - AR: $12M
   - Annual revenue: $100M
   - Days in year: 365
   - DSO: ($12M / $100M) × 365 = 43.8 days

   Interpretation:
   - Takes approximately 44 days to collect from customers
   - If terms are Net 30: 14 days overdue on average
   - Improvement target: Reduce to Net 30 (30 days)

   Industry benchmarks:
   - Retail: 20-30 days (point-of-sale cash)
   - B2B Manufacturing: 40-60 days (Net 30/45 terms)
   - Utilities: 30-40 days (bills paid by mail)
   - Construction: 45-90 days (project-based)

3. Days Inventory Outstanding (DIO)
   Formula: (Inventory / Cost of Goods Sold) × Days in Period

   Example:
   - Inventory: $18M
   - COGS: $60M (annual)
   - Days: 365
   - DIO: ($18M / $60M) × 365 = 109.5 days

   Interpretation:
   - Inventory sits approximately 110 days before sold
   - For 90-day inventory: 20 days excess
   - Ties up $3.6M in excess working capital

   Industry benchmarks:
   - Fast-moving goods (CPG): 15-30 days
   - Fashion retail: 60-120 days (seasonal)
   - Automotive manufacturing: 45-60 days
   - Specialized equipment: 90-180 days

4. Days Payable Outstanding (DPO)
   Formula: (Accounts Payable / COGS) × Days in Period

   Example:
   - Payables: $8M
   - COGS: $60M
   - Days: 365
   - DPO: ($8M / $60M) × 365 = 48.7 days

   Interpretation:
   - Average payment to vendors takes 49 days
   - Mix of Net 30 and Net 60 terms
   - Extension opportunities exist if terms allow

   Optimization:
   - Extend to Net 60 (if suppliers allow)
   - Would increase DPO to ~65 days
   - Release approximately $8M in cash

5. Working Capital Ratio
   Formula: Current Assets / Current Liabilities

   Calculation (using above example):
   - Current assets: $36M
   - Current liabilities: $15M
   - Ratio: 36 / 15 = 2.4x

   Interpretation:
   - $2.40 in current assets per $1 debt
   - Generally 1.5x-2.5x is healthy
   - Below 1.0x: Liquidity stressed
   - Above 3.0x: Possibly inefficient (excess cash)

6. Quick Ratio (Acid Test)
   Formula: (Current Assets - Inventory) / Current Liabilities

   Calculation:
   - Current assets minus inventory: $36M - $18M = $18M
   - Current liabilities: $15M
   - Quick ratio: 18 / 15 = 1.2x

   Interpretation:
   - $1.20 in liquid assets per $1 liability (excluding inventory)
   - More conservative than working capital ratio
   - 1.0x or higher generally acceptable
Cash Conversion Cycle Analysis
Interpreting CCC:
Positive CCC (Most Common):
- Company needs financing for 50+ days
- Must finance with own cash or loans
- Example: Manufacturing, wholesale

Negative CCC (Rare, Highly Efficient):
- Company gets paid before paying suppliers
- Examples: Walmart (40-day CCC turns negative),
           Amazon (similar dynamic possible)
- Suppliers finance company's inventory
- Dream scenario (unlikely for most)

CCC Improvement Scenarios:

Scenario 1: Reduce DSO (Collect Faster)
Current position:
- DIO: 45 days, DSO: 45, DPO: 30
- CCC: 45 + 45 - 30 = 60 days
- Working capital: $16.4M (based on annual $100M revenue)

Improvement: Reduce DSO to 30 days
- DIO: 45, DSO: 30, DPO: 30
- New CCC: 45 days
- New WC needed: $12.3M
- Cash released: $4.1M

Scenario 2: Reduce DIO (Lower Inventory)
Current: 60-day CCC
Improvement: Reduce DIO to 40 days (just-in-time)
- DIO: 40, DSO: 45, DPO: 30
- New CCC: 55 days
- Cash released: ~$1.4M

Scenario 3: Extend DPO (Pay Later)
Current: 60-day CCC
Improvement: Extend DPO to 45 days (negotiate terms)
- DIO: 45, DSO: 45, DPO: 45
- New CCC: 45 days
- Cash released: ~$4.1M

Combined Improvements:
All three actions together:
- Reduce DSO to 30 (collect faster)
- Reduce DIO to 35 (less inventory)
- Extend DPO to 45 (pay later)
- New calculation: 35 + 30 - 45 = 20 days
- From 60 to 20 days: 67% improvement
- Could release $13+ million in cash
Accounts Receivable Management
Credit Policy and Collection
Establishing Credit Terms:
Standard Business Terms:

Net 30:
- Most common B2B term
- Invoice due 30 days from invoice date
- Example: Invoice dated Jan 1, due Jan 31
- Industry standard for most sectors

Net 45/Net 60:
- Longer terms (more customer friendly)
- Used for larger accounts
- Relationship-based negotiation
- Higher DSO impact (15+ days additional)

2/10 Net 30:
- 2% discount if paid within 10 days
- Otherwise due in 30 days
- Incentivizes early payment
- Reduces DSO if effective

Cash on Delivery (COD):
- Payment required with delivery
- No financing offered
- Minimizes credit risk
- Least favorable to customers (rarely offered)

Credit Card (Consumer):
- Immediate payment (in effect)
- Processing fees reduce margin
- Minimal DSO (1-2 days)
- Common for retail/SaaS

Policy Components:

1. Credit Standards
   - Which customers eligible
   - Credit limit per account
   - Financial review criteria
   - Red flags disqualifying

2. Collection Procedures
   - Initial follow-up (invoice sent)
   - First reminder (5 days overdue)
   - Second reminder (15 days overdue)
   - Escalation (30 days overdue)
   - Collections agency (60+ days)
   - Write-off (accounting decision)

3. Discount Programs
   - Whether offering discounts for early payment
   - Discount percentage (1-3% typical)
   - Timeline for discount
   - Cost/benefit analysis

4. Default Consequences
   - Late payment fees (if state allows)
   - Interest on past-due amounts (per contract/law)
   - Suspension of future sales
   - Required prepayment on future orders
Collections and Bad Debt:
Aging Schedule (Critical Monitoring Tool):

Current Receivables Breakdown:
- 0-30 days: $7.2M (60% of total AR)
- 31-60 days: $3.0M (25%)
- 61-90 days: $1.2M (10%)
- 90+ days: $0.6M (5%)
Total AR: $12.0M

Analysis:
- Most AR current (good sign)
- 5% over 90 days is concerning
- Should investigate $600K overdue accounts
- Potential bad debt exposure

Collection Process Priority:

Over 90 days (Immediate):
- Direct contact with customer
- Determine why unpaid (dispute, financial issue)
- Require payment within 7 days
- If no payment: Stop further credit, consider collections agency

61-90 days (Urgent):
- Remind customer of past-due status
- Request payment within 15 days
- Offer payment plan if customer in financial strain

31-60 days (Routine):
- Standard past-due notice
- Ask for payment confirmation
- Identify processing delays

0-30 days (Standard):
- No action if customer meets terms
- Monitor for repeat late payers

Bad Debt & Write-offs:

Accounts Receivable Reserve Method:
- Estimate % of AR that won't be collected
- Typical: 1-5% of outstanding AR
- Based on historical experience
- Age of AR (older = higher risk)
- Customer credit rating

Calculation:
AR by age and reserve:
- 0-30 days: $7.2M × 0.5% = $36K reserve
- 31-60 days: $3.0M × 2% = $60K reserve
- 61-90 days: $1.2M × 5% = $60K reserve
- 90+ days: $0.6M × 15% = $90K reserve
- Total reserve: $246K

Allowance for Doubtful Accounts:
- Balance sheet: AR of $12M less $246K = $11.75M (net)
- P&L impact: $246K charge to bad debt expense
- Year-end adjustment as needed

Write-off Decision:
- After collection attempts exhausted (90-120+ days)
- Customer bankruptcy filing
- Customer out of business
- Debt legally uncollectible
- After write-off: Can't later recover funds

Tax Implications:
- Accrual basis: Reserve method deductible
- Cash basis: Only actual bad debts deductible
- Must remove from records (journal entry)
- Documentation for tax purposes
Operational Efficiency
Invoicing and Collection Best Practices:
Accelerate Revenue Recognition/Cash Receipt:

1. Accurate Invoicing
   ✓ Invoice immediately upon shipment/service
   ✓ Correct customer details (can cause delays)
   ✓ Invoice number, amount, due date clear
   ✓ Include payment instructions
   ✓ Include delivery/service confirmation

2. Invoice Formatting
   ✓ Professional appearance (companies pay faster)
   ✓ Clear terms and conditions
   ✓ Itemized billing (customers understand)
   ✓ Payment methods provided (check, wire, ACH)
   ✓ Contact for questions

3. Collection Communication
   ✓ Email reminders (automated systems effective)
   ✓ Escalating frequency as age increases
   ✓ Personalized for major accounts
   ✓ Clear amount due, due date
   ✓ Payment instructions in each communication

4. Early Payment Incentives
   ✓ 2/10 Net 30 discount program
   ✓ Value proposition: Customer saves money
   ✓ Lower customer cost = willing to pay early
   ✓ Analysis: 2% discount for 20-day acceleration
     Annual rate: 2% × (365/20) = 36% (expensive)
     Only worthwhile if cost of capital lower

5. Online Payment Integration
   ✓ Credit card processing (1.5-3% fee)
   ✓ ACH bank transfer (lower cost, slower)
   ✓ Payment portal (customer convenience)
   ✓ Automated reminders (when payment due)
   ✓ Payment confirmation (reduces disputes)

6. Contract Clauses
   ✓ Clear payment terms (Net 30, etc.)
   ✓ Explicit due date
   ✓ Late payment penalties (if enforceable)
   ✓ Interest on past-due (varies by jurisdiction)
   ✓ Right to suspend services (if not paid)

Example Efficiency Improvements:
Company optimizing collections:

Before:
- Invoice processing: 5 days after shipment
- Manual follow-up (some customers missed)
- Inconsistent collection efforts
- DSO: 50 days
- AR: 80% current, 15% overdue, 5% very past due

Actions:
1. Automated invoice (same day as shipment): Saves 5 days
2. Automated reminders (email on day 5, 15, 25): Improves collection
3. Dedicated collections staff (one person, part-time): Escalates overdue
4. Late fees program: Encourages early payment
5. Early payment discount (2% for 10 days): Accelerates payment

After (6-month implementation):
- DSO: 35 days (15-day improvement)
- AR: 85% current, 12% 31-60 days, 3% over 60
- Bad debt: Down from ~2% to 0.5%
- Cash released: ~$16M (using $100M revenue example)
- Payback on collections investment: < 1 year
Inventory Management
Inventory Optimization
Reducing DIO (Days Inventory Outstanding):
Inventory Reduction Goals:

Current State:
- Inventory: $18M
- COGS: $60M
- DIO: 109.5 days (110 days on average)
- Working capital tied up: $18M

Target State:
- Reduce to industry benchmark: 75 days
- New inventory: 75 / 365 × $60M = $12.3M
- Cash released: $5.7M

How to Achieve:

1. Demand Forecasting (Critical)
   ✓ Accurate forecasting = Reduced safety stock
   ✓ Use historical data, seasonal patterns
   ✓ Integrate sales/marketing input
   ✓ Regular forecast updates (monthly minimum)

   Forecast Error Example:
   - Forecast: 1,000 units (quarterly)
   - Actual: 750 units
   - Excess inventory: 250 units (obsolescence risk)
   - Cost: 250 units × $50 cost = $12,500
   - Inventory waste + working capital cost

2. Just-in-Time (JIT) Inventory
   ✓ Receive inventory only as needed
   ✓ Reduces safety stock requirements
   ✓ Minimizes obsolescence risk
   ✓ Requires reliable suppliers

   JIT Requirements:
   - Supplier reliability (on-time delivery critical)
   - Supply chain flexibility
   - Product shelf-life (perishables harder)
   - Demand variability (JIT works best with stable demand)

   Example JIT Success (Auto Industry):
   - Supplier delivers parts daily (not quarterly)
   - Company produces on receipt
   - Inventory turns every 1-2 days
   - DIO: 2-5 days (vs. traditional 45-90)
   - Massive working capital savings

   JIT Limitations:
   ✗ Supply disruptions create stock-outs
   ✗ Less negotiating power (can't order in bulk)
   ✗ Higher transportation costs (more frequent shipments)
   ✗ Supplier relationships critical (less flexibility)

3. Inventory Turnover Improvement
   Formula: COGS / Average Inventory

   Current turnover:
   - COGS: $60M
   - Inventory: $18M
   - Turnover: 60 / 18 = 3.3x (per year, ~110 days)

   Industry benchmarks:
   - Fast-moving consumer goods (CPG): 15-20x (24-30 days)
   - Retail clothing: 3-5x (75-120 days)
   - Auto manufacturing: 8-12x (30-45 days)
   - Specialty equipment: 1-2x (180-365 days)

   Target improvement:
   - From 3.3x to 6x turnover (50% improvement)
   - New inventory: $60M / 6 = $10M
   - Cash released: $8M

4. Inventory Classification (ABC Analysis)
   Classify by value impact:

   A Items (High value, ~80% of cost):
   - Tighter controls
   - Frequent counting (monthly)
   - Better forecasting
   - Smaller safety stock

   B Items (Medium value, ~15% of cost):
   - Standard controls
   - Quarterly review
   - Standard safety stock

   C Items (Low value, ~5% of cost):
   - Minimal controls
   - Less frequent counts
   - Higher safety stock acceptable
   - Less critical to optimize

   Example:
   - A Items: $12M inventory, target 60 days = $1.97M reduction potential
   - B Items: $4M inventory, target 90 days = $0.67M potential
   - C Items: $2M inventory, less critical
   - Total potential: $2.6M+ cash release (from inventory alone)

5. SKU Rationalization
   ✓ Eliminate slow-moving products
   ✓ Consolidate variants
   ✓ Focus on best sellers
   ✓ Reduce inventory management complexity

   Example:
   - 5,000 SKUs currently (product variations)
   - 500 SKUs account for 80% of sales
   - Eliminate bottom 4,500 SKUs
   - Reduces inventory 30%
   - Improves forecast accuracy (fewer products)
   - Easier to manage
Write-Down and Obsolescence:
Obsolete Inventory Write-downs:

Risk of Inventory Optimization:
- Aggressive reduction = stock-outs
- Stock-outs = Lost sales
- Low inventory = Obsolescence risk less
- But = Less margin for error

Monitoring for Obsolescence:
- Track items not sold in 12+ months
- Review for discontinued products
- Check for technological changes
- Monitor expiration dates (perishables)

Inventory Reserve:
- Method similar to bad debt reserves
- Estimate % likely to become obsolete
- Typical: 5-15% of inventory (varies significantly)
- Higher if fast-moving industry (fashion, technology)

Example Obsolescence Scenario:
- Fashion inventory (seasonal)
- Spring collection: 200 items, $4M cost
- End of season: 30% didn't sell well
- Markdown necessary to liquidate
- Reserve for markdown loss: 8% of inventory
- Charge to P&L: $320K
- Reduces inventory on B/S to $3.68M net

Write-off Decision:
- If inventory becomes completely unsellable
- Donate to charity (tax deduction possible)
- Scrap or destroy
- Remove from inventory
- Charge net cost to P&L
Accounts Payable and Cash Management
Payables Optimization
Extending Payment Terms:
Strategic Payment Timing:

Current Situation:
- DPO: 30 days (Net 30 standard terms)
- Payables: $8M
- Annual COGS: $60M

Analysis:
- If extending to Net 45: DPO increases to 45 days
- New payables: (45/30) × $8M = $12M
- Cash retained: $4M

Negotiation Approach:
- For key suppliers: Direct negotiation
- Request Net 45 or Net 60
- Offer: Faster payment (week earlier from terms)
- Show: Payment reliability history
- Incentive: Order growth, reduced admin

Implementation:
- Start with lowest-risk vendors
- Larger suppliers (less dependent on you)
- Build track record of extended terms
- Expand to more suppliers over time

Avoiding Pitfalls:
✗ Don't extend terms without supplier agreement
✗ Don't abuse supplier payment (damages relationship)
✗ Don't sacrifice supplier relationship for working capital
✗ Don't get cut off (working capital won't matter if can't operate)

Risks of Aggressive Payment Extension:
- Suppliers reduce credit or require advance payment
- Supply disruption (supplier prioritizes other customers)
- Quality decline (supplier perceives lower priority)
- Early payment discount loss (forgo 2% to extend terms: false economy)

Calculation of Early Payment Discount Economics:
Annual interest rate of early payment discount:
- 2% discount for 10-day early payment (vs. 30-day terms)
- Implied annual rate: 2% × (365 / 20 days) = 36.5% annually
- Cost of capital (borrowing rate): Likely 5-10%
- Financial math: Don't take discount if cost of capital lower
  (better to use capital for operations)
- But: Should NOT pay just to extend terms if supplier offers discount
Supplier Relationship Management:
Vendor Tiering Strategy:

Tier 1 (Critical Suppliers):
- Few alternatives
- High switching cost
- Significant volume dependency
- Approach: Closer relationships, reliable payment
- Payment terms: Standard or slightly extended

Tier 2 (Important Suppliers):
- Multiple alternatives but switching has cost
- Moderate volume
- Payment terms: Standard (Net 30, etc.)
- Approach: Balance: reliable payment with some negotiation

Tier 3 (Commodity Suppliers):
- Many alternatives
- Low cost to switch
- Payment terms: Can be more aggressive
- Approach: Negotiate for extended terms (more leverage)

Example Tiering:
Company with 100 suppliers:

Tier 1 (10 suppliers): $35M spend (58%)
- Critical component suppliers (cannot easily replace)
- Payment: Net 30 (standard)
- Relationship: Very good, on-time payment, regular reviews

Tier 2 (25 suppliers): $20M spend (33%)
- Important but alternatives exist
- Payment: Net 45 (some negotiated)
- Relationship: Good, reliable payment

Tier 3 (65 suppliers): $5M spend (9%)
- Commodity items, many suppliers
- Payment: Net 60 (more aggressive)
- Approach: Competitive sourcing

DPO Impact:
- Tier 1 @ Net 30: $2.9M
- Tier 2 @ Net 45: $2.5M
- Tier 3 @ Net 60: $0.8M
- Total payables: $6.2M
- DPO: ($6.2M / $60M) × 365 = 37.7 days

This balanced approach maximizes working capital
while maintaining supplier relationships.
Working Capital Financing
Short-Term Financing Options
Asset-Based Lending:
Asset-based line of credit:
- Borrow against accounts receivable and inventory
- Typical structure: AR up to 80%, Inventory up to 50%

Example:
- AR: $12M (borrow up to 80%) = $9.6M available
- Inventory: $18M (borrow up to 50%) = $9M available
- Total borrowing capacity: $18.6M

Cost of borrowing:
- Interest rate: Prime + 2.5-3.5%
- Example: Prime (8%) + 3% = 11% annual
- On $10M borrowed: $1.1M annual cost
- Monthly cost: ~$92K

Advantages:
✓ Flexible (borrow/repay as needed)
✓ Based on assets (not credit only)
✓ Can grow with business

Disadvantages:
✗ Secured by assets (lender has claim)
✗ Covenants (financial requirements)
✗ Expensive (interest + fees)
✗ Restrictions (who can use proceeds, restrictions on other debt)

Typical Covenants:
- Minimum working capital ratio (1.5x+)
- Maximum debt ratios
- Regular financial reporting
- Inventory turnover minimums
- DSO maximum (limits receivables aging)
- Restrictions on asset sales
Supply Chain Financing:
Supplier-Financed Working Capital:

Concept: Supplier finances inventory until sold
Example: Retailer receives goods from supplier
- Payment deferred until goods sell
- Supplier retains title until paid
- Reduces retailer's inventory financing burden

Benefits to Supplier:
- Maintains customer relationship
- Encourages order growth
- Reduces competitor risk (customer locked in)
- Improves cash position (known payment coming)

Example (Retail):
Retailer receives $1M seasonal inventory
- Traditional: Retailer borrows $500K on term, $500K from cash
  (carrying cost: interest + working capital)
- Supplier financing: Supplier waits 60 days for payment
  (retailer sells inventory, pays from proceeds)
  (retailer's working capital: Zero impact)

Reverse Factoring:
- Buyer (large company) arranges financing for supplier
- Supplier gets early payment (less discount)
- Buyer extends payment terms
- All parties benefit

Example:
Manufacturing company wants to extend supplier payment from Net 30 to Net 60:
- Without financing: Supplier loses cash flow (refuses)
- With reverse factoring:
  - Finance company pays supplier on day 15 (for invoice)
  - Manufacturer pays finance company on day 60
  - Supplier gets cash without waiting
  - Manufacturer extends payables
  - Finance company earns small fee/interest
  - All parties satisfied
Working Capital KPIs and Monitoring
Dashboard and Metrics
Regular Monitoring:
Monthly Reporting Requirements:

Working Capital Statement:
|                          | This Month | Prior Month | Variance |
|--------------------------|------------|-------------|----------|
| AR (average)             | $12.0M     | $11.9M      | ($0.1M)  |
| Days Sales Outstanding   | 43.2 days  | 42.8 days   | (0.4)    |
| Inventory (average)      | $18.5M     | $18.3M      | ($0.2M)  |
| Days Inventory Out       | 112 days   | 111 days    | (1.0)    |
| AP (average)             | $8.5M      | $8.2M       | ($0.3M)  |
| Days Payable Out         | 51.8 days  | 49.6 days   | (2.2)    |
| **CCC**                  | **50 days**| **52 days** | **2.0**  |
| Working Capital          | $22.0M     | $22.0M      | $ —      |

Interpretation:
- DSO slightly worsened (took an extra 5 hours to collect)
- DIO slightly worsened (inventory turned slightly slower)
- DPO improved (extended payment by 1.3 days)
- CCC improved (net working capital cycle shortened by 2 days)
- Overall: WC stable month-over-month

Exception Reports:
AR aging > 60 days: $2.1M (highlight for immediate attention)
Inventory obsolescence reserve: $1.2M (up $0.1M month)
Payables due > 60 days: $0.6M (payment scheduling issue)
Performance Improvement Tracking:
Working Capital Improvement Project:

Baseline (Year 0):
- DSO: 45 days
- DIO: 110 days
- DPO: 30 days
- CCC: 125 days
- Cash tied up: $34.2M (annualized)

Target (Year 2):
- DSO: 35 days (reduce by 10 days)
- DIO: 75 days (reduce by 35 days)
- DPO: 45 days (extend by 15 days)
- CCC: 65 days (reduce by 60 days)
- Cash released: ~$16.4M

Tracking Progress:

Year 1 Results:
- DSO: 42 days (3-day improvement)
- DIO: 95 days (15-day improvement)
- DPO: 38 days (8-day improvement)
- CCC: 99 days (26-day improvement)
- Cash released: $7.1M
- Status: On track (50% of 2-year target met in year 1)

Year 2 Results (projected):
- Continue initiatives
- Expand to additional areas
- Meet or exceed targets
- Total cash release: $16M+ (or $16.4M target)

Impact on Financial Metrics:
- Operating cash flow improves
- Company can fund growth without additional borrowing
- Debt levels decline (if applied to debt paydown)
- Valuation improvement (cash flow increases)
- Return on assets improves
Sector-Specific Considerations
Different Industries
Working Capital Variations by Industry:
Retail (High Inventory, Moderate Receivables):
- Typical CCC: 20-40 days
- Focus: Inventory turnover (critical)
- DSO: Low (mostly credit card, immediate payment)
- DIO: Variable (seasonal, fashion unpredictable)
- DPO: 30-45 days (supplier negotiations)
- Challenge: Obsolescence of seasonal inventory
- Opportunity: Extend supplier payment terms

Manufacturing (High Inventory & AP):
- Typical CCC: 60-90 days
- Focus: Inventory management (raw materials, WIP, FG)
- DSO: 45-60 days (B2B Net 30/45 terms)
- DIO: 90-120 days (production cycle)
- DPO: 30-45 days (supplier terms)
- Challenge: Balancing large raw material inventory with production needs
- Opportunity: Just-in-time inventory implementation

Software/SaaS (Negative or Low CCC):
- Typical CCC: -30 to 20 days
- Focus: Subscription model advantages
- DSO: Low (credit card, upfront payment)
- DIO: Minimal (no physical inventory)
- DPO: Standard 30 days
- Advantage: Customers pre-pay, create float
- Challenge: Revenue recognition timing

Construction (Extremely Long CCC):
- Typical CCC: 120-180 days
- Focus: Managing progress billing, change orders
- DSO: 45-90 days (depends on payment terms)
- DIO: Minimal (materials on-site, minimal holding)
- DPO: 30-60 days
- Challenge: Long project cycles, extended payment terms
- Opportunity: Manage change orders, progress billing

Healthcare (Moderate to High CCC):
- Typical CCC: 60-100 days
- Focus: Managing insurance receivables (complex)
- DSO: 45-75 days (insurance payments slower)
- DIO: Moderate (medical supplies, equipment)
- DPO: 30-45 days
- Challenge: Insurance denials, coding issues
- Opportunity: Billing accuracy, insurance follow-up
Conclusion
Working capital management directly impacts cash flow and financial health. Success requires:
Critical Working Capital Success Factors:
- Measure and Monitor
- Calculate CCC regularly (monthly minimum)
- Track DSO, DIO, DPO separately
- Identify trends and variances
- Set improvement targets
- Optimize Receivables
- Implement efficient collections processes
- Monitor aging and act promptly on overdue
- Establish incentives for early payment (where cost-effective)
- Build customer relationships to encourage payment
- Manage Inventory
- Improve demand forecasting accuracy
- Implement just-in-time where feasible
- Eliminate obsolete inventory
- Use ABC analysis for focus areas
- Extend Payables
- Negotiate longer terms with suppliers
- Maintain strong supplier relationships
- Don’t sacrifice quality for working capital
- Balance with supplier viability
- Use Technology
- Automated invoicing and collections
- Inventory management systems
- Cash flow forecasting tools
- Dashboard for real-time monitoring
- Drive Organizational Alignment
- Sales understands payment term impact
- Operations understands inventory goals
- Finance monitors metrics
- Executive team reviews regularly
Expected Results:
Comprehensive working capital optimization typically yields:
- 10-20% CCC reduction (20-40 day improvement)
- $5-15M cash release (varies by company size)
- Improved operating cash flow (improves valuation)
- Reduced financing needs (lower borrowing costs)
- Enhanced financial flexibility
Final Recommendation:
Working capital management offers tremendous value with relatively low investment. Every company should review its CCC annually and identify improvement opportunities. The amount of cash typically trapped in working capital represents significant untapped value that can be released through disciplined management and operational excellence.
Resources
- Cash Management Tools: Treasury management systems (various vendors)
- Financial Analytics: Business intelligence platforms for working capital dashboards
- Invoicing/Collections: AP/AR automation platforms (Coupa, Bill.com, others)
- Inventory Management: ERP systems (SAP, Oracle), specialized inventory systems
- Professional Support: CFO advisory services, working capital consultants
- Industry Benchmarks: Reuters Eikon, Bloomberg, Trade associations
- Best Practices: Industry associations, CFO forums, peer benchmarking networks