Cap Table Management: Complete Guide to Ownership Tracking, Dilution, and Capitalization (2026)
schema: | { “@context”: “https://schema.org”, “@graph”: [ { “@type”: “Article”, “headline”: “Cap Table Management: Complete Guide to Ownership Tracking, Dilution, and Capitalization (2026)”, “description”: “Comprehensive guide to cap table management including ownership structure, equity dilution, preferred stock, liquidation preferences, anti-dilution, and capitalization modeling. Essential for founders, investors, and CFOs.”, “image”: “https://bato.com.np/assets/images/cap-table.jpg”, “datePublished”: “2026-02-19”, “dateModified”: “2026-02-21”, “author”: { “@type”: “Person”, “name”: “Marcus Chen” }, “publisher”: { “@type”: “Organization”, “name”: “BATO - Business Audit & Tax Organization”, “logo”: { “@type”: “ImageObject”, “url”: “https://bato.com.np/assets/images/logo.png” } } } ] }
An accurate cap table is the foundation of startup capital management. This guide covers ownership tracking, dilution analysis, and fundraising mechanics.
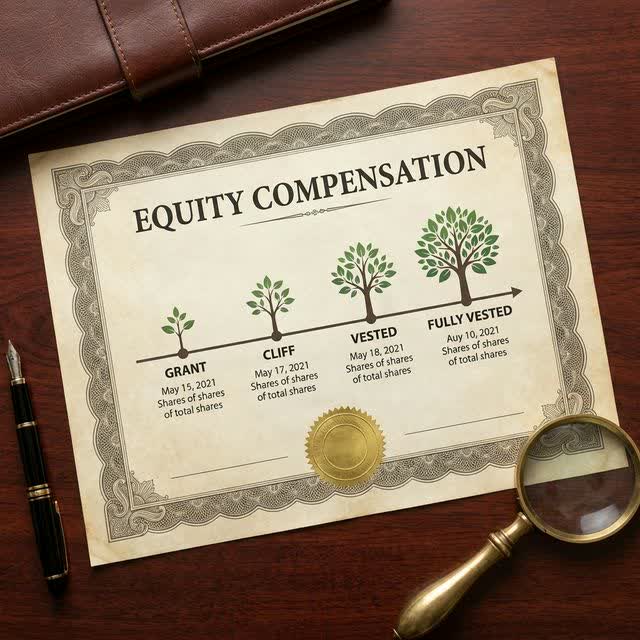
Proper cap table management is essential throughout the company lifecycle—from initial incorporation through Series A fundraising and potential IPO. Founders must track all equity compensation grants to employees, model dilution from financing rounds, and ensure accurate fully-diluted share counts for regulatory compliance.
Cap Table Fundamentals
Understanding Ownership Structure
Common Cap Table Elements:
Basic Cap Table Example (Seed Stage):
Shareholder Shares Ownership % Value@$5M
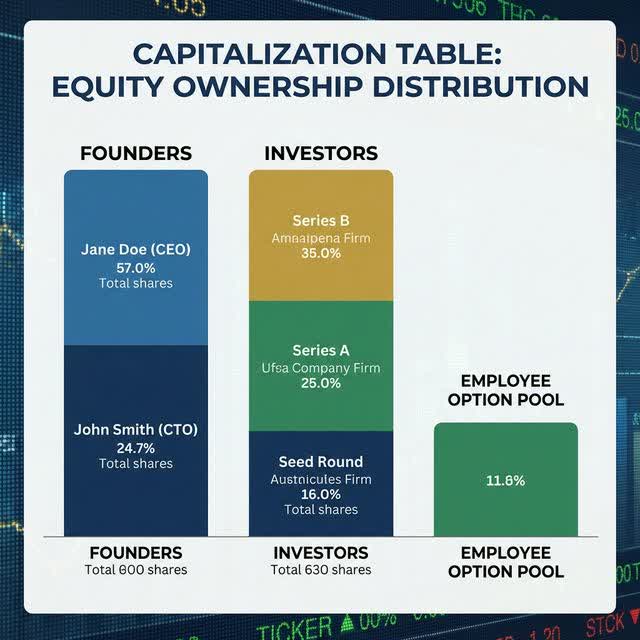
Founder A 3,000,000 60% $3.0M
Founder B 1,500,000 30% $1.5M
Advisor 1 300,000 6% $0.3M
Reserve Pool 200,000 4% $0.2M
Total Common 5,000,000 100% $5.0M
Post-Series A Raise (Investor buys $2M at $10M post):
New Cap Table:
Shareholder Shares Ownership % Value@$10M
Founder A 3,000,000 30% $3.0M
Founder B 1,500,000 15% $1.5M
Series A Investor 1,000,000 10% $1.0M*
Advisor 1 300,000 3% $0.3M
New Employee Pool 2,000,000 20% $2.0M
Reserve 1,200,000 12% $1.2M
Common (Old) 4,500,000 45% $4.5M
Preferred (Series A) 2,000,000 20% $2.0M
Total 10,500,000 100% $10.5M
*Note: Preferred has liquidation preference
(gets $2M back before common)
Key Observations:
- Founder A diluted: 60% → 30% (despite no sale)
- New employee pool: Created post-Series A
- Preferred vs Common: Separate classes
Counting Shares and Ownership
Fully Diluted Analysis:
Why Fully-Diluted Matters:

Treasury Stock Method:
- Assumes all options/RSUs exercised
- Proceeds used to repurchase shares at FMV
- Shows potential future ownership

Example:

Scenario: Company pre-Series A (pre-seed funding)

Current Cap Table (Simple):
Founder A:  2.5M shares (50%)
Founder B:  2.5M shares (50%)
Total:      5M shares

Options Granted:
Employee 1: 500K options @ $0.10 strike
Employee 2: 250K options @ $0.05 strike

Current FMV: $0.50/share (409A valuation)

Basic Dilution Calculation:
If all options exercised immediately:
- Employee 1 exercises: Pays 500K × $0.10 = $50K
  Receives 500K shares
- Employee 2 exercises: Pays 250K × $0.05 = $12.5K
  Receives 250K shares
- New total: 6M shares
- Founder dilution: 50% → 2.5M/6M = 41.7%

Treasury Stock Method (More Accurate):
- Employee 1 exercise: $50K proceeds
  Company repurchases: $50K / $0.50 = 100K shares
  Net dilution: 500K - 100K = 400K
- Employee 2 exercise: $12.5K proceeds
  Company repurchases: $12.5K / $0.50 = 25K shares
  Net dilution: 250K - 25K = 225K
- Net share issuance: 625K
- New total: 5.625M shares
- Founder dilution: 50% → 2.5M/5.625M = 44.4%

Fully Diluted Ownership Percentages:

Common Stock Outstanding: 5.0M
Options Outstanding: 0.75M (treasury stock method: 0.625M net)
Series A Preferred Issued: 1.0M

Founders' Stake:
- Actual ownership: 2.5M common / 5M shares = 50%
- Fully diluted: 2.5M / (5M + 0.625M + 1M) = 2.5M / 6.625M = 37.7%
- Series A investors view founders as 37.7% owners
- Second round investors evaluate at fully-diluted
Fundraising Mechanics
Series A Funding Round
Structuring a Series:
Series A Term Sheet Key Elements:

Valuation:
- Pre-money valuation: Company value before investor money
- Post-money valuation: Company value after investment
- Investment amount determines ownership %

Example:
- Company: Currently worth $5M pre-money
- Series A raises $2M at $5M pre (calculated post = $7M)
- Investor ownership: $2M / $7M = 28.6%
- Or alternatively stated: $2M / $5M pre = 40% dilution to existing

Price Per Share:
- Determined by valuation / fully-diluted shares outstanding
- Example: $5M pre-money ÷ 5M shares = $1.00/share
- Investor buys: $2M ÷ $1.00 = 2M shares (at post-money $2.50)

Post-Series Capitalization:
Pre-Series:
- Common shares: 5M @ $1.00 FMV = $5M
- Options: 0.75M outstanding

Post-Series:
- Common shares: 5M @ $2.50 FMV = $12.5M
- Preferred shares: 2M @ $2.50 = $5M (Series A)
- Options: Reserve 1M @ $2.50 FMV

Investor Rights Package:

1. Liquidation Preference
   Typical: 1x non-participating preferred

   Meaning: In liquidation/sale, investor gets $2M back
            before common shareholders receive anything

   Example: Company sells for $5M
   - Investor preferred: $2M (first)
   - Remaining $3M → Common shareholders
   - If company sells for $1M: Investor gets $1M (loss)

   Non-participating: Investor chooses either 1x preference
                     or pro-rata participation, not both

2. Board Seat
   - Investor appoints 1 board member
   - Founders appoint 1-2 directors
   - Neutrals appoint remaining (if any)
   - Board: 3-5 members typical at Series A

3. Pro-Rata Rights
   - Investor can participate in future rounds
   - Maintains ownership %
   - Optional (investor can choose to invest or not)

4. Anti-Dilution
   - Protects against down rounds
   - Weighted-average: Most common
   - Full ratchet: Rare (punitive to founders)

   Example (Weighted-Average):
   Series A: $2M at $2.50/share = 800K shares
   Series B: Down round at $1.50/share (down 40%)

   Weighted-average adjustment:
   Old price: $2.50
   New price: $1.50
   Fully-diluted shares: 6.5M (including options)
   Adjustment: [(5M × $2.50) + $2M] / (6.5M + new shares)

   Result: Series A share price adjusted down slightly
          Series A gets additional shares at no cost
          (compensates for down round)

5. Drag-Along Rights
   - Founders can force minority to sell
   - If majority agrees to acquisition
   - Prevents holdout minority blocking exit

6. Redemption Rights
   - Investor can force buyback after period
   - Common for later stage (not seed/A)
   - Rare with growth-stage companies

Due Diligence Requirements:

Investor Due Diligence (What they'll verify):
✓ Business fundamentals (revenue, growth, unit economics)
✓ Cap table accuracy (fully-diluted ownership)
✓ 409A valuations (compliance)
✓ IP assignment (founders properly own IP)
✓ Employee agreements (no equity disputes)
✓ Material contracts (key customer/vendor)
✓ Legal status (no litigation, IP infringement claims)

Cleanliness (Cap Table Focus):
✓ All founders properly assigned shares
✓ All employee options properly documented
✓ No disputed equity (family members, co-founders)
✓ No vested interests from prior rounds
✓ Fully-diluted cap table documented
✓ 409A valuations for all equity grants
✓ Board resolutions for all grants
✓ No equity escrow still pending (clean break)
Anti-Dilution and Liquidation Preferences
Managing Dilution
Common Anti-Dilution Mechanisms:
Weighted-Average Anti-Dilution:

Scenario: Down Round
Series A: 800K shares @ $2.50 = $2M invested
Series B: 400K shares @ $1.50 = $0.6M
(Company valued lower than Series A price)

Without Anti-Dilution:
- Series A ownership: 800K / (5M + 0.8M + 0.4M) = 12.3%
- Value at Series B price: 800K × $1.50 = $1.2M (40% loss)

With Weighted-Average Anti-Dilution:
Adjustment formula:
New P = (Old P × Old Fully-Diluted Shares + $ Raised) / (New Fully-Diluted Shares)

Calculation:
Old P: $2.50
Old FD shares: 5.8M (common 5M + Series A 0.8M)
$ Raised: $2M (Series A)
New shares Series B: 400K
New FD shares: 6.2M

New P = ($2.50 × 5.8M + $2M) / 6.2M = $16.5M / 6.2M = $2.66

Series A Adjustment:
- Original: 800K shares @ $2.50
- Adjusted: 800K × ($2.50/$2.66) = 752K shares (wait, wrong direction)
- Actually: Series A gets additional shares
- New adjustment: If price goes down, existing stockholders get more shares at original price
- Effective Series A price: $2.50 maintained
- Adjustment: Series A gets ~35K additional shares (cost = net dilution absorbed)
- New Series A: 835K shares @ $2.50 effective

Outcome:
- Series A ownership: 835K / 6.2M = 13.5% (vs. 12.3% without)
- Founders diluted more to compensate Series A

Full Ratchet Anti-Dilution (Founder-Hostile):

Same Down Round Scenario:
- Series A keeps 800K shares
- BUT: All conversions happen @ new price $1.50
- Series A 800K @ $1.50 = $1.2M value (vs. $2M invested)
- Result: Automatic adjustment credits them for the loss
- Extremely punitive to founders
- Rare now (investors use weighted-average instead)

Cap on Anti-Dilution:
Many deals limit anti-dilution to:
- Only in down rounds (not all near-par rounds)
- Maximum adjustment (e.g., can't adjust below 0.5x original price)
- Time limit (e.g., 3 years only)
Liquidation Preferences
Exit Scenarios and Payouts:
Scenario: Company exits via acquisition

Sale Price: $8M
Debt Payoff: $0.5M (convertible notes, etc.)
Net Proceeds: $7.5M

Cap Table at Exit:
Common (Founders):     5M shares
Series A Preferred:    2M shares @ $2.50 = $5M invested
Series B Preferred:    1M shares @ $1.50 = $1.5M invested

Liquidation Waterfall (1x Non-Participating Preferred):

Priority 1: Series B Preferred
- Liquidation preference: 1x = $1.5M
- Allocation: $1.5M
- Remaining: $6.0M

Priority 2: Series A Preferred
- Liquidation preference: 1x = $5M
- But only $6M remaining
- Allocation: $5M
- Remaining: $1.0M

Priority 3: Common (Founders)
- Remaining: $1.0M
- Split between 5M shares = $0.20/share
- Founder distribution: Less than Series A payout

Payouts:
Series B investors: $1.5M (returned capital, zero gain)
Series A investors: $5M (full return, breakeven)
Founders: $1M (loss on opportunity cost, opportunity loss)

Alternative: Participating Preferred

If Series A had:
Participating: 1x multiply + pro-rata participation

Same $8M exit:
Priority 1: Series B Preferred
- 1x liquidation: $1.5M
- Remaining: $6.5M

Priority 2: Series A Preferred (1x non-participating alternative)
- 1x liquidation: $2M
- Pro-rata participating: 2M/(5M+2M) × $4.5M = $1.3M
- Total: $2M + $1.3M = $3.3M (better than non-participating)

Priority 3: Common
- Remaining: $3.2M

Payouts (Participating):
Series B: $1.5M
Series A: $3.3M
Founders: $3.2M

Comparison:
- Non-participating (standard now): Founders get $1M
- Participating (worse for founders): Founders get $3.2M
- Founders prefer non-participating preferred (less investor preference)

Senior/Pari-Passu Preferred:

If Company has:
Series A (2M @ $5M invested)
Series B (1M @ $1.5M invested)
Series C (1M @ $2M invested)

Liquidation Preferences:
All 1x non-participating, pari-passu (equal)

Waterfall:
1. All preferred gets 1x: $5M + $1.5M + $2M = $8.5M
   But only $7.5M available (short $1M)

2. Pro-rata allocation of $7.5M:
   Series A: $5M / $8.5M × $7.5M = $4.41M
   Series B: $1.5M / $8.5M × $7.5M = $1.32M
   Series C: $2M / $8.5M × $7.5M = $1.76M

3. Common shareholders: $0 (nothing left)

Series C took risk, got liquidated pari-passu (got hurt equally)
Founders: Complete loss
Cap Table Software and Administration
Tools and Best Practices:
Cap Table Management Solutions:

Manual (Small Companies, Seed Stage):
- Excel spreadsheet
- Manually updated
- Cost: $0 (time: 5-20 hours/round)
- Risk: Errors, version control, audit trail

Disadvantages:
✗ Manual calculations (dilution errors possible)
✗ No audit trail (disputes difficult to resolve)
✗ Single point of failure (one person updates)
✗ No integration (separate from bank, option tracking)

Specialized Software:

Carta (Market Leader):
- Cap table management
- Option tracking
- 409A valuation integration
- Investor communications
- Cost: $5,000-50,000/year (scales with company)
- Users: 6,000+ companies

Pulley:
- Simpler interface
- Focus on equity management
- Valuation management
- Cost: $500-5,000/year
- Users: Growing market

Certent (Workday):
- Enterprise-grade
- Complex equity structures
- Merger/acquisition modeling
- Cost: $20,000+/year
- Users: Late-stage/public companies

Key Features Needed:
✓ Multiple share class tracking
✓ Anti-dilution adjustments (automatic)
✓ Equity scenario modeling
✓ 409A valuation management
✓ Board-approved grant tracking
✓ Fully-diluted calculations
✓ Investor reporting/portal
✓ Option exercise processing
✓ Tax lot tracking

Annual Cap Table Reconciliation:

Process:
1. Full share count (all classes)
2. Outstanding options (all grants, all vesting)
3. Reserved option pool
4. Fully-diluted shares
5. Ownership % calculations
6. Verify all grants board-approved
7. Verify all 409A valuations current
8. Attorney review (optional but recommended)

Frequency: Annual minimum, post-round best practice
Cost: Internal FTE (20-40 hours) or external counsel ($2,000-5,000)

Cap Table Controls/Hygiene:

Best Practices:
✓ Board approval for all grants
✓ Written grant agreements (not verbal)
✓ 409A valuations pre-grant
✓ Vesting schedule documentation
✓ Exercise tracking (when exercised, proceeds, tax withholding)
✓ Termination tracking (unvested forfeiture, exercise windows)
✓ Annual investor reporting
✓ Founder agreement documentation (initial equity allocation)
✓ IP assignment agreements (from founders)
✓ Employee confidentiality/option acknowledgment

Disputes and Resolutions:

Common Disputes:
- Co-founder departure: Who owns equity?
  (Normally: Vested owned, unvested forfeited unless negotiated)

- Advisor equity vesting: When did it vest?
  (Document vesting schedule at grant time)

- Liquidation preference: What's the payout?
  (Cap table should clearly state; calculate waterfall)

Prevention:
✓ Written agreements (founder agreement at start)
✓ Clear vesting terms (cliff + schedule, not assumed)
✓ Regular cap table updates (quarterly)
✓ Annual reconciliation (with board minutes)
✓ Board documentation (of all grants, approvals)
Conclusion
An accurate, well-managed cap table is essential for startup fundraising, investor relations, and exit planning. Key points:
- Maintain Accurate Records
- Board-approved grants
- 409A valuations
- Clear vesting schedules
- Fully-diluted calculations
- Understand Dilution Mechanics
- Anti-dilution protection
- Liquidation preferences
- Pro-rata rights
- Impact on founder ownership
- Plan for Growth
- Reserve option pools for employees
- Refresh grants at each round
- Model multiple fundraising scenarios
- Plan for down-round possibilities
- Use Proper Tools
- Invest in cap table software (Carta, etc.)
- Eliminate ad-hoc spreadsheets
- Automate calculations
- Maintain audit trail
- Communicate Transparently
- Employee education on dilution
- Investor reporting
- Clear exit payout modeling
- Annual cap table reconciliation
Resources
- Cap Table Software: Carta, Pulley, Certent
- Valuation Services: 409A appraisers, integrated in cap table tools
- Legal Templates: NCSA, LawGeex, startup counsel
- Investor Resources: GVFL, CVF (term sheet resources)
- Education: Stratos, Equity Zen, founder communities