Cash Flow Forecast Template 2026: 13-Week and 12-Month Model That Auditors Trust
Model Structure
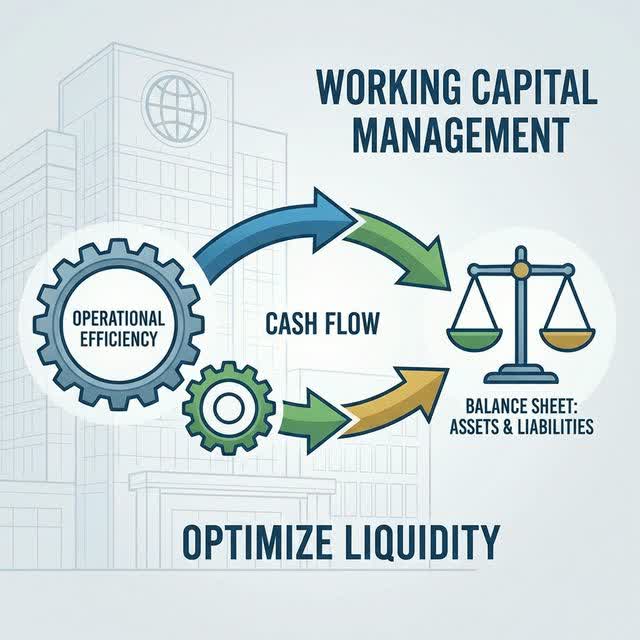
13-week: beginning cash + collections − payroll − AP − debt − tax = ending cash, weekly. 12-month: revenue drivers → collections lag → headcount → opex → capex → debt → tax.
Pair with Cash-Flow Analysis, Collections, Burn/Runway, and Going Concern.
Inputs Checklist
- AR aging + terms + dispute haircut.
- AP + payroll calendars — see Payroll and Multi-State.
- Debt service + covenants — see Debt.
- Tax estimates — see Estimated Taxes.
- Tie to GL actuals monthly — see Month-End Close.
Link to FP&A Software and Treasury.
Variance Discipline
Report forecast vs actual with owner and action weekly (13-week) and monthly (12-month). Persisted optimism without assumption change is a control failure — see SOX 404.
Retain versions per Audit Procedures for PBC and lender review.
Worked Example: 13-Week Cash Squeeze Found Early
Starting cash $850k, monthly burn ~$210k. Week-by-week direct forecast:
| Week | Collections | Payroll+AP+debt | Ending cash |
|---|---|---|---|
| 1–4 | $180k | $230k | $680k |
| 5–8 | $150k | $235k | $445k |
| 9–12 | $190k | $225k | $210k |
| 13 | $60k | $215k | $55k |
Without the forecast, the company discovers the $55k trough when payroll bounces. With it (built in week 1), management accelerates $120k of collections (early-pay discounts — see Collections), defers $80k capex, and draws the revolver in week 8 — see Debt. Total effort: one working session. That is the entire ROI case for weekly forecasting.
Driver Model for the 12-Month View
Direct receipts don’t scale to 12 months — switch to drivers:
- Revenue → collections lag. Bookings × historical collection curve (e.g., 40% current month, 45% next, 12% following, 3% bad). Re-calibrate the curve quarterly against DSO actuals.
- Headcount → payroll. Every approved req is a cash date, not a start date (recruiting lag + first payroll offset). Tie to the hiring plan in Burn/Runway.
- Contracts → fixed outflows. Rent, SaaS annuals, insurance, debt service on exact dates — the “surprise” outflows that break annual forecasts are always knowable.
- Tax → estimates. Quarterly estimates plus provision true-ups — see Estimated Taxes.
Reconcile the 12-month model’s first 13 weeks to the direct forecast monthly. Persistent gaps mean a driver is wrong — usually the collection lag after a terms change.
Variance Report That Changes Behavior
| Line | Forecast | Actual | Variance | Owner + action |
|---|---|---|---|---|
| Collections | $180k | $141k | −$39k | AR lead: top-3 late accounts called, payment dates secured |
| Payroll | $150k | $162k | +$12k | Controller: 2 unbudgeted contractors, freeze or approve |
| Capex | $40k | $0 | −$40k | CFO: server delay to next month (timing, not saving) |
Rules: every variance over threshold gets an owner and a dated action; “timing” must name the catch-up week; three consecutive same-direction misses trigger a driver re-calibration, not another optimistic rollforward. File versions for PBC and lender review — lenders trust forecasts with honest variances more than perfect ones.
FAQ
Direct or indirect method?
Direct (receipts/disbursements) for 13-week; indirect bridge for 12-month board view. Reconcile both to cash.
How do covenants link?
Minimum liquidity and DSCR tested on forecast — breach early warning beats breach notice.
Next Steps
- Lock 13-week for payroll coverage this week.
- Build 12-month drivers with owners.
- Report variance to leadership monthly.